This article is about the provincial electoral district. For the federal electoral district of a similar name, see Pitt Meadows—Maple Ridge.
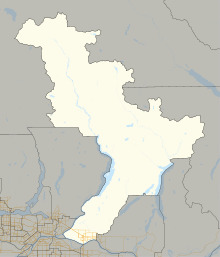
Maple Ridge-Pitt Meadows is a provincial electoral district for the Legislative Assembly of British Columbia , Canada. The 2008 re-distribution is an amalgamation of the old Maple Ridge-Pitt Meadows riding with an addition of a small portion of the old Maple Ridge-Mission .[1]
Demographics Population, 2001 56,272 Population Change, 1996–2001 8.2% Area (km²) 112.75 Pop. Density (people per km²) 499
Geography 1999 redistribution Changes from Maple Ridge-Pitt Meadows to Maple Ridge-Pitt Meadows include:
Removal of the majority of land in the District of Maple Ridge Removal of Douglas Island[1] History The riding was created for the 1991 election from part of the dual-member Dewdney riding.
Members of the Legislative Assembly Assembly Years Member Party Dewdney 35th 1991–1996 William James Hartley New Democratic 36th 1996–2001 37th 2001–2005 Ken Stewart Liberal 38th 2005–2009 Michael Sather New Democratic 39th 2009–2013 40th 2013–2017 Doug Bing Liberal 41st 2017–2020 Lisa Beare New Democratic 42nd 2020–present
Election results
2020 British Columbia general election Party Candidate Votes % Expenditures New Democratic Lisa Beare 15,877 63.41 +18.61 $47,200.48 Liberal Cheryl Ashlie 9,163 36.59 −2.21 $42,453.66 Total valid votes 25,040 100.00 – Total rejected ballots Turnout Registered voters Source: Elections BC [2] [3]
2017 British Columbia general election Party Candidate Votes % Expenditures New Democratic Lisa Beare 12,045 44.80 +1.92 $60,276 Liberal Doug Bing 10,428 38.79 −6.70 $55,180 Green Alex Pope 3,329 12.38 +3.23 $6,534 Conservative Gary John O'Driscoll 676 2.51 +0.03 Independent Steve Ranta 408 1.52 – $979 Total valid votes 26,886 100.00 Total rejected ballots 173 0.64 Turnout 27,059 64.50 Source: Elections BC [4]
2013 British Columbia general election Party Candidate Votes % Expenditures Liberal Doug Bing 10,824 45.49 -0.26 $50,220 New Democratic Elizabeth Joan Rosenau 10,204 42.88 -4.19 $61,491 Green Michael Lawrence Patterson 2,178 9.15 +3.62 $1,188 No Affiliation Manuel "Mike" Pratas 589 2.48 – $1,320 Total valid votes 23,795 100.00 – Total rejected ballots 184 0.77 +0.14 Turnout 23,979 59.87 +2.97 Liberal gain from New Democratic Swing +1.96 Source: Elections BC [5] [6]
Pratas campaigned with the BC Conservative Party but was listed as "No affiliation" on the ballot.
2009 British Columbia general election Party Candidate Votes % New Democratic Michael Sather 9232 46.91 +0.53 Liberal Ken Stewart 9062 46.04 +3.30 Green Rob Hornsey 1064 5.41 −1.95 Independent Chum Richardson 194 0.99 – Refederation Jay Ariken 129 0.66 –
2005 British Columbia general election Party Candidate Votes % New Democratic Michael Sather 11,786 46.38 Liberal Ken Stewart 10,861 42.74 Green Mike Gildersleeve 1,869 7.36 Democratic Reform Rick Butler 534 2.10 Marijuana Denise Briere-Smart 360 1.42 Total 25,410 100.00
2001 British Columbia general election Party Candidate Votes % Expenditures Liberal Ken Stewart 12,235 52.96 $39,898 New Democratic Bill Hartley 5,764 24.95 $22,812 Green Mike Gildersleeve 3,069 13.29 $2,437 Unity Dave Hensman 1,220 5.28 $7,515 Marijuana Rick Cameron 716 3.10 $394 Action Michael Felgner 97 0.42 $300 Total valid votes 23,101 100.00 Total rejected ballots 77 0.33 Turnout 23,178 72.90
1996 British Columbia general election Party Candidate Votes % Expenditures New Democratic Bill Hartley 12,946 46.07 $34,860 Liberal Ken Stewart 10,960 39.00 $52,898 Progressive Democrat Peter Neufeld 2,011 7.16 $412 Reform Nick Walsh 1,470 5.23 – Green Richard Hennick 464 1.65 $100 Libertarian Lewis Clarke Dahlby 158 0.56 – Natural Law Matt Deacon 90 0.32 $118 Total valid votes 28,099 100.00 Total rejected ballots 137 0.49 Turnout 28,236 73.30
1991 British Columbia general election Party Candidate Votes % Expenditures New Democratic Bill Hartley 11,591 45.16 $28,734 Liberal Steve Gilmore 8,786 34.23 $5,377 Social Credit Roman Evancic 4,986 19.42 $26,959 Green David B. Pehota 305 1.19 $310 Total valid votes 25,668 100.00 Total rejected ballots 335 1.29 Turnout 26,003 77.02 New Democratic notional gain from Social Credit Swing N/A
References External links