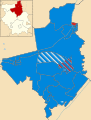
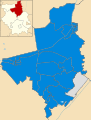
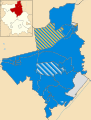
Fenland rejected the introduction of a directly elected mayor by 17,296 votes to 5,509, on a turnout of just under 34%, in a referendum held in July 2005.[2]
Political control
Since the foundation of the council in 1973 political control of the council has been held by the following parties:[3]
^ abcdefLocal elections in Britain: a statistical digest, edited by Colin Rallings and Michael Thrasher. 1993
^The Times reported this election result as Conservative 18, Labour 8, Independent 14. "Liberals capture Eastbourne and exceed ambition to win 1,000 loval government seats". The Times. 9 June 1973.
^"Heavy Labour losses in district polls". The Times. 8 May 1976.
^The Times reported this election result as Conservative 19, Labour 8, Liberal 4, SDP 2, Independent 7. "How votes were cast in local government elections". The Times. 7 May 1983.
^"Results in Thursday's local elections". The Times. 9 May 1987.
^The Times reported this election result as Conservative 28, Labour 6, Liberal Democrat 2, Independent 4. "Complete round-up of results from Thursday's local council elections". The Times. 4 May 1991.
^"Complete list of results from Thursday's council elections". The Times. 6 May 1995. p. 10.
This article is copied from an article on Wikipedia® - the free encyclopedia created and edited by its online user community. The text was not checked or edited by anyone on our staff. Although the vast majority of Wikipedia® encyclopedia articles provide accurate and timely information, please do not assume the accuracy of any particular article. This article is distributed under the terms of GNU Free Documentation License.
All content on this website, including dictionary, thesaurus, literature, geography, and other reference data is for informational purposes only. This information should not be considered complete, up to date, and is not intended to be used in place of a visit, consultation, or advice of a legal, medical, or any other professional.