Wikipedia

Cooling curve

Also found in: Encyclopedia.
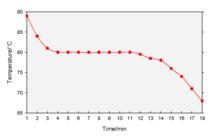
A cooling curve of naphthalene from liquid to solid.

A cooling curve is a line graph that represents the change of phase of matter, typically from a gas to a solid or a liquid to a solid. The independent variable (X-axis) is time and the dependent variable (Y-axis) is temperature.[1] Below is an example of a cooling curve used in castings.

Cooling curve pure metal.svg

The initial point of the graph is the starting temperature of the matter, here noted as the "pouring temperature". When the phase change occurs, there is a "thermal arrest"; that is, the temperature stays constant. This is because the matter has more internal energy as a liquid or gas than in the state that it is cooling to. The amount of energy required for a phase change is known as latent heat. The "cooling rate" is the slope of the cooling curve at any point.

References

  1. ^ Garland, Nibler, and Shoemaker. Experiments in Physical Chemistry (7th ed.)
This article is copied from an article on Wikipedia® - the free encyclopedia created and edited by its online user community. The text was not checked or edited by anyone on our staff. Although the vast majority of Wikipedia® encyclopedia articles provide accurate and timely information, please do not assume the accuracy of any particular article. This article is distributed under the terms of GNU Free Documentation License.

Copyright © 2003-2025 Farlex, Inc Disclaimer
All content on this website, including dictionary, thesaurus, literature, geography, and other reference data is for informational purposes only. This information should not be considered complete, up to date, and is not intended to be used in place of a visit, consultation, or advice of a legal, medical, or any other professional.