Newbury is a constituency[n 1] represented in the House of Commons of the UK Parliament from 2019 by Laura Farris, a Conservative.[n 2] It was created by the Redistribution of Seats Act 1885 and has been in continual existence since then.
Profile
The constituency consists of most of West Berkshire and includes Newbury, Thatcham and Hungerford. To the east, the rest of West Berkshire is incorporated into the Wokingham and Reading West constituencies.[n 3]
Since its creation it has been a Conservative or Liberal/Liberal Democrat seat, sometimes seemingly marginal and sometimes seen as a safe seat, with a tendency towards being Conservative.[n 4] West Berkshire which is similar to its neighbours has a rather thriving economy with the headquarters of the communications company Vodafone that has created a cluster of around 80 mobile phone related businesses in Newbury,[2] while the Lambourn area is the second most important centre for the racehorse industry in Great Britain, employing over 800 people directly, and producing an annual income of £20 million.[3]
West Berkshire is also home to Atomic Weapons Establishment, near Aldermaston, Wolseley plc, Bayer and PepsiCo. There are high proportions of detached and semi-detached housing, and lower than average dependency on social housing.[4][5] The seat includes the former family home of Catherine, Duchess of Cambridge, wife of Prince William, Duke of Cambridge in Bucklebury.
- Neighbouring constituencies
The constituencies bordering Newbury (clockwise from north) are: Wantage, Henley, Reading West, Wokingham, Basingstoke, North West Hampshire and Devizes.
History
The Newbury constituency in 1954
Originally, Newbury was part of a larger constituency of Berkshire, which returned two Members of Parliament (MPs), increased to three in the Reform Act of 1832. In the Redistribution of Seats Act of 1885 Berkshire was divided into three county constituencies, Northern (Abingdon), Southern (Newbury), and Eastern (Wokingham), and two borough constituencies, Reading and New Windsor, each returning one member.
The Conservatives have held the constituency for all but seventeen years since the creation of the seat - only three spells of Liberal Party, or Liberal Democrat, majorities have intersected their control. In 2015, the party held the largest majority in the seat since 1935 at 46%, before being reduced to 40.1% in 2017.
Since the February 1974 election, the Liberal Democrats have been one of the two largest parties in the constituency. They most recently gained the seat at the 1993 by-election, holding it until 2005 where it was regained by the Conservatives.
The constituency in 2010 produced the third lowest share of the vote for Labour (4.3%), one of five lost deposits for Labour nationally, below the 5% of the vote deposit threshold.[6][n 5] In 2017, Labour earned its highest share of the vote in Newbury since the October 1974 election with 14.1% of the vote.
It was estimated that the constituency voted 51% in favour of remaining in the European Union during the 2016 referendum on EU membership, with 49% voting to leave.[7]
Boundaries and boundary changes
.png)
A graph plotting the election results for Newbury.(larger version and key)
1885–1918: The constituency was created as the Southern or Newbury Division of Berkshire under the Redistribution of Seats Act 1885, when the three-member Parliamentary County of Berkshire was divided into the three single-member constituencies of Abingdon, Newbury and Wokingham. It comprised the Boroughs of Newbury and Reading, the Sessional Divisions of Ilsley, Lambourn, Newbury (including Hungerford), and Reading (except the parishes of East Swallowfield and West Swallowfield), and part of the Sessional Division of Wokingham.[8] Only non-resident freeholders of the municipal borough Reading (which comprised the Parliamentary Borough of Reading) were entitled to vote.
1918–1950: The Boroughs of Newbury and Wokingham, the Rural Districts of Hungerford and Newbury, and parts of the Rural Districts of Bradfield and Wokingham.[9]
Extended eastwards, with the addition of Wokingham and surrounding areas from the abolished Wokingham Division of Berkshire. Small northern part transferred to Abingdon and areas which had been annexed by Reading County Borough transferred to the Parliamentary Borough.
1950–1955: The Borough of Newbury, and the Rural Districts of Bradfield, Hungerford, and Newbury.[9]
Wokingham and rural areas to the south and east of Reading transferred to the re-established County Constituency of Wokingham. Small area transferred from Abingdon.
1955–1974: The Borough of Newbury, the Rural Districts of Bradfield, Hungerford, and Newbury, and the County Borough of Reading ward of Tilehurst.[9]
Gained the Tilehurst ward from the abolished Borough Constituency of Reading North. From the 1964 general election, the Reading wards of Norcot and Tilehurst were included[9] following a revision to the local authority wards.
1974–1983: As 1950.[9]
The Norcot and Tilehurst wards transferred back to the re-established Borough Constituency of Reading North.
1983–1997: The District of Newbury wards of Aldermaston, Basildon, Beenham, Bradfield, Bucklebury, Burghfield, Chieveley, Cold Ash, Compton, Craven, Downlands, Falkland, Greenham, Hungerford, Kintbury, Lambourn Valley, Mortimer, Northcroft, St John's, Shaw-cum-Donnington, Speen, Thatcham North, Thatcham South, Thatcham West, Turnpike, and Winchcombe.[10]
Gained a small area of the abolished County Constituency of Abingdon (part of the former Rural District of Wantage) which had been retained by Berkshire when the rest of the area comprising Abingdon was transferred to Oxfordshire by the Local Government Act 1972. Areas to the west of Reading included in the new County Constituency of Reading West.
1997–2010: The District of Newbury wards of Aldermaston, Basildon, Beenham, Bradfield, Bucklebury, Chieveley, Cold Ash, Compton, Craven, Downlands, Falkland, Greenham, Hungerford, Kintbury, Lambourn Valley, Northcroft, St John's, Shaw-cum-Donnington, Speen, Thatcham North, Thatcham South, Thatcham West, Turnpike, and Winchcombe.[11]
Small loss to Wokingham in the east of the constituency (Burghfield and Mortimer wards).
2010–present: The District of West Berkshire wards of Aldermaston, Basildon, Bucklebury, Chieveley, Clay Hill, Cold Ash, Compton, Downlands, Falkland, Greenham, Hungerford, Kintbury, Lambourn Valley, Northcroft, St John's, Speen, Thatcham Central, Thatcham North, Thatcham South and Crookham, Thatcham West, and Victoria.[12]
Further minor loss to Wokingham.
Members of Parliament
An incumbent MP has been defeated just four times, in the elections of 1906, 1923, 1924, and 2005.
Elections
Elections in the 2010s
General election 2019: Newbury[14] | Party | Candidate | Votes | % | |
| | Conservative | Laura Farris | 34,431 | 57.4 | -4.1 |
| | Liberal Democrats | Lee Dillon | 18,384 | 30.6 | +9.2 |
| | Labour | James Wilder | 4,404 | 7.3 | -6.8 |
| | Green | Stephen Masters | 2,454 | 4.1 | +1.6 |
| | Independent | Ben Holden-Crowther | 325 | 0.5 | n/a |
| Majority | 16,047 | 26.8 | -13.3 |
| Turnout | 59,998 | 71.9 | -1.5 |
| | Conservative hold | Swing | -6.7 | |
General election 2017: Newbury[15] | Party | Candidate | Votes | % | |
| | Conservative | Richard Benyon | 37,399 | 61.5 | +0.4 |
| | Liberal Democrats | Judith Bunting | 13,019 | 21.4 | +6.4 |
| | Labour | Alex Skirvin | 8,596 | 14.1 | +5.7 |
| | Green | Paul Field | 1,531 | 2.5 | -1.5 |
| | Apolitical Democrats | Dave Yates | 304 | 0.5 | +0.1 |
| Majority | 24,380 | 40.1 | -6.0 |
| Turnout | 60,849 | 73.4 | +1.3 |
| | Conservative hold | Swing | -3.0 | |
General election 2015: Newbury[16][17][18] | Party | Candidate | Votes | % | |
| | Conservative | Richard Benyon | 34,973 | 61.0 | +4.6 |
| | Liberal Democrats | Judith Bunting | 8,605 | 15.0 | -20.5 |
| | UKIP | Catherine Anderson | 6,195 | 10.8 | +8.3 |
| | Labour | Jonny Roberts | 4,837 | 8.4 | +4.2 |
| | Green | Paul Field | 2,324 | 4.1 | +3.2 |
| | Apolitical Democrats | Peter Norman | 228 | 0.4 | +0.2 |
| | Independent | Barrie Singleton | 85 | 0.1 | N/A |
| | Patriotic Socialist Party | Andrew Stott | 53 | 0.1 | N/A |
| Majority | 26,368 | 46.0 | +25.1 |
| Turnout | 57,300 | 72.1 | +1.9 |
| | Conservative hold | Swing | +12.6 | |
General election 2010: Newbury[19] | Party | Candidate | Votes | % | |
| | Conservative | Richard Benyon | 33,057 | 56.4 | +7.4 |
| | Liberal Democrats | David Rendel | 20,809 | 35.5 | −7.1 |
| | Labour | Hannah Cooper | 2,505 | 4.3 | −1.7 |
| | UKIP | David Black | 1,475 | 2.5 | +0.9 |
| | Green | Adrian Hollister | 490 | 0.8 | +0.8 |
| | Independent | Brian Burgess | 158 | 0.3 | +0.3 |
| | Apolitical Democrat | David Yates | 95 | 0.2 | +0.2 |
| Majority | 12,248 | 20.9 | +14.6 |
| Turnout | 58,589 | 70.2 | −2.4 |
| | Conservative hold | Swing | 7.3 | |
Elections in the 2000s
Elections in the 1990s
By-election 1993: Newbury | Party | Candidate | Votes | % | |
| | Liberal Democrats | David Rendel | 37,590 | 65.1 | +27.8 |
| | Conservative | Julian Davidson | 15,535 | 26.9 | −29.0 |
| | Labour | Steve Billcliffe | 1,151 | 2.0 | −4.0 |
| | Anti-Federalist League | Alan Sked | 601 | 1.0 | N/A |
| | Conservative Candidate | Andrew Bannon | 561 | 1.0 | N/A |
| | Commoners' Party | Stephen Martin | 435 | 0.8 | N/A |
| | Monster Raving Loony | Screaming Lord Sutch | 432 | 0.7 | N/A |
| | Green | Jim Wallis | 341 | 0.6 | −0.2 |
| | Referendum Party | Robin Marlar | 338 | 0.6 | N/A |
| | Conservative Rebel | John Browne | 267 | 0.5 | N/A |
| | Corrective Party | Lindi St Clair | 170 | 0.3 | N/A |
| | Maastricht Referendum for Britain | Bill Board | 84 | 0.1 | N/A |
| | Natural Law | Michael Grenville | 60 | 0.1 | N/A |
| | People & Pensioners Party | Johnathon Day | 49 | 0.1 | N/A |
| | 21st Century Independent Foresters | Colin Palmer | 40 | 0.1 | N/A |
| | Defence of Children's Humanity Bosnia | Mladen Grbin | 33 | 0.1 | N/A |
| | SDP | Alan Page | 33 | 0.1 | N/A |
| | Communist (PCC) | Anne Murphy | 32 | 0.1 | N/A |
| | Give The Royal Billions To Schools | Michael Stone | 21 | 0.1 | N/A |
| Majority | 22,055 | 38.2 | N/A |
| Turnout | 57,399 | 71.3 | −11.46 |
| | Liberal Democrats gain from Conservative | Swing | 28.4 | |
Elections in the 1980s
Elections in the 1970s
After the 1970 general election, Newbury's boundaries were altered to reduce the size of the electorate which had grown to over 85,000. After the boundary changes, the electorate numbered around 72,000 people. This came into effect for the first general election in February 1974.
General election 1970: Newbury | Party | Candidate | Votes | % | |
| | Conservative | John Astor | 30,380 | 48.8 | +3.5 |
| | Labour | Timothy Sims | 18,647 | 29.9 | −8.1 |
| | Liberal | Dane Clouston | 13,279 | 21.3 | +4.6 |
| Majority | 11,733 | 18.9 | +11.7 |
| Turnout | 55,392 | 72.6 | −6.5 |
| | Conservative hold | Swing | | |
Elections in the 1960s
General election 1966: Newbury | Party | Candidate | Votes | % | |
| | Conservative | John Astor | 25,908 | 45.3 | −0.1 |
| | Labour | Ronald Spiller | 21,762 | 38.0 | +3.6 |
| | Liberal | Stanley Clement Davies | 9,571 | 16.7 | −3.5 |
| Majority | 4,146 | 7.2 | −3.7 |
| Turnout | 57,241 | 79.1 | −0.2 |
| | Conservative hold | Swing | | |
Elections in the 1950s
General election 1950: Newbury | Party | Candidate | Votes | % | |
| | Conservative | Anthony Hurd | 18,150 | 52.8 | +0.4 |
| | Labour | Colin Jackson | 11,914 | 34.7 | +1.0 |
| | Liberal | Edwin Burrows | 4,284 | 12.5 | -0.5 |
| Majority | 6,236 | 18.1 | -0.6 |
| Turnout | 34,348 | 81.1 | +15.7 |
| | Conservative hold | Swing | | |
Elections in the 1940s
Elections in the 1930s
In the 1931 general election, Howard Clifton Brown of the Conservative Party was re-elected unopposed.
Elections in the 1920s
General election 1929: Newbury | Party | Candidate | Votes | % | |
| | Unionist | Howard Clifton Brown | 17,800 | 51.0 | −4.9 |
| | Liberal | Edward Harold Brooks | 13,604 | 39.0 | −0.5 |
| | Labour | Frank Jacques | 3,471 | 10.0 | +5.4 |
| Majority | 4,196 | 12.0 | −4.4 |
| Turnout | 34,875 | 78.3 | −2.6 |
| | Unionist hold | Swing | -2.2 | |
General election 1924: Newbury | Party | Candidate | Votes | % | |
| | Unionist | Howard Clifton Brown | 14,759 | 55.9 | +6.0 |
| | Liberal | Harold Stranger | 10,444 | 39.5 | −10.6 |
| | Labour | Frank Jacques | 1,219 | 4.6 | N/A |
| Majority | 4,315 | 16.4 | N/A |
| Turnout | 26,422 | 80.9 | +9.6 |
| | Unionist gain from Liberal | Swing | | |
General election 1922: Newbury[27] | Party | Candidate | Votes | % | |
| | Unionist | Howard Clifton Brown | 12,322 | 57.4 | N/A |
| | Liberal | Harold Stranger | 9,144 | 42.6 | N/A |
| Majority | 3,178 | 14.8 | N/A |
| Turnout | 21,466 | 69.7 | N/A |
| | Unionist hold | Swing | N/A | |
By-election, 1922: Newbury | Party | Candidate | Votes | % | |
| C | Unionist | Howard Clifton Brown | Unopposed |
| | Unionist hold |
| C indicates candidate endorsed by the coalition government. |
Elections in the 1910s
General election 1918: Newbury | Party | Candidate | Votes | % | |
| C | Unionist | William Mount | Unopposed |
| | Unionist hold |
| C indicates candidate endorsed by the coalition government. |
Elections in the 1900s
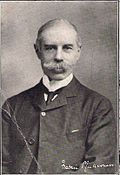
Mackarness
Elections in the 1890s
Elections in the 1880s
See also
Notes and references
- Notes
- ^ A county constituency (for the purposes of election expenses and type of returning officer)
- ^ As with all constituencies, the constituency elects one Member of Parliament (MP) by the first past the post system of election at least every five years.
- ^ Burghfield, Mortimer and Sulhamstead; and, respectively Burch Copse, Calcot, Pangbourne, Purley on Thames, Theale and Westwood
- ^ The total period served by either a Liberal or Liberal Democrat MP is 17 years, Conservative MPs have served for the remaining 110 years (to the end of 2012)
- ^ Other lost Labour deposits took place in Eastbourne, Somerton & Frome, Cornwall North and Westmorland & Lonsdale
- References
Sources
External links
)
)
.png'))
)