Manicouagan Quebec electoral district Quebec electoral district |
|---|
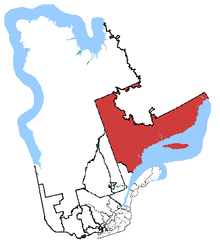 Manicouagan in relation to other Quebec federal electoral districts |
| Federal electoral district |
|---|
| Legislature | House of Commons |
|---|
| MP | Marilène Gill
Bloc Québécois |
|---|
| District created | 1966 |
|---|
| First contested | 1968 |
|---|
| Last contested | 2019 |
|---|
| District webpage | profile, map |
|---|
| Demographics |
|---|
| Population (2016)[1] | 92,518 |
|---|
| Electors (2019) | 72,256 |
|---|
| Area (km²)[2] | 264,226 |
|---|
| Pop. density (per km²) | 0.35 |
|---|
| Census division(s) | Basse-Côte-Nord Territory, Caniapiscau RCM, Manicouagan RCM, Minganie RCM, Sept-Rivières RCM |
|---|
| Census subdivision(s) | Baie-Comeau, Chute-aux-Outardes, Côte-Nord-du-Golfe-du-Saint-Laurent, Fermont, Havre-Saint-Pierre, Pessamit, Port-Cartier, Sept-Îles, Maliotenam, Uashat |
|---|
Manicouagan is a federal electoral district in Quebec, Canada, that has been represented in the House of Commons of Canada since 1968.
The riding was created in 1966 from parts of Charlevoix and Saguenay ridings.
The neighbouring ridings are Abitibi—Baie-James—Nunavik—Eeyou, Chicoutimi—Le Fjord, Montmorency—Charlevoix—Haute-Côte-Nord, Haute-Gaspésie—La Mitis—Matane—Matapédia, Gaspésie—Îles-de-la-Madeleine and Labrador.
This riding gained territory from Montmorency—Charlevoix—Haute-Côte-Nord during the 2012 electoral redistribution.
It is named after the Manicouagan crater and it may also be a variant on Irish Naming convention (from Mac Aodhagáin), "Mhic Aogáin" or literally, "Egan's Wife".
Demographics
- According to the Canada 2016 Census
- Languages: (2016) 85.5% French, 8.7% Innu, 4.5% English, 0.6% Naskapi, 0.1% Spanish, 0.1% Arabic, 0.1% Italian, 0.1% Portuguese[3]
Members of Parliament
This riding has elected the following Members of Parliament:
Election results
Graph of election results in Manicouagan (minor parties that never got 2% of the vote or didn't run consistently are omitted)
| 2019 Canadian federal election |
| Party | Candidate | Votes | % | | Expenditures |
| | Bloc Québécois | Marilène Gill | 21,768 | 53.90 | | $18,875.24 |
| | Liberal | Dave Savard | 7,793 | 19.29 | | $36,651.32 |
| | Conservative | François Corriveau | 7,771 | 19.24 | | $30,489.35 |
| | New Democratic | Colleen McCool | 1,482 | 3.67 | | $0.33 |
| | Green | Jacques Gélineau | 1,293 | 3.20 | | none listed |
| | People's | Gabriel Côté | 283 | 0.70 | | none listed |
| Total valid votes/Expense limit | 40,390 | 100.0 |
| Total rejected ballots | 712 |
| Turnout | 41,102 | 56.9 |
| Eligible voters | 72,256 |
| Source: Elections Canada[4][5] |
| 2015 Canadian federal election |
| Party | Candidate | Votes | % | | Expenditures |
| | Bloc Québécois | Marilène Gill | 17,338 | 41.25 | +8.57 | $19,611.43 |
| | Liberal | Mario Tremblay | 12,343 | 29.37 | +23.86 | $9,363.37 |
| | New Democratic | Jonathan Genest-Jourdain | 7,359 | 17.51 | -30.17 | $24,554.75 |
| | Conservative | Yvon Boudreau | 4,317 | 10.27 | -1.36 | $16,863.38 |
| | Green | Nathan Grills | 673 | 1.60 | -0.91 | – |
| Total valid votes/Expense limit | 42,030 | 100.00 | | $259,798.61 |
| Total rejected ballots | 645 | 1.51 | – |
| Turnout | 75,030 | 56.88 | – |
| Eligible voters | 75,030 |
| | Bloc Québécois gain from New Democratic | Swing | +19.37 |
| Source: Elections Canada[6][7] |
| 2011 Canadian federal election |
| Party | Candidate | Votes | % | | Expenditures |
| | New Democratic | Jonathan Genest-Jourdain | 16,437 | 48.93 | +44.1 | |
| | Bloc Québécois | Gérard Asselin | 10,495 | 31.24 | -18.1 | |
| | Conservative | Gordon Ferguson | 3,878 | 11.55 | -15.5 | |
| | Liberal | André Forbes[fn 1] | 1,882 | 5.60 | -9.7 | |
| | Green | Jacques Gélineau | 898 | 2.67 | -0.9 | |
| Total valid votes/Expense limit | 33,590 | 100.00 |
| Total rejected ballots | 524 | 1.54 | +0.1 |
| Turnout | 34,114 | 52.10 | – |
| Eligible voters | 65,481 | – | – |
| 2008 Canadian federal election |
| Party | Candidate | Votes | % | | Expenditures |
| | Bloc Québécois | Gérard Asselin | 15,272 | 49.3 | -1.8 | $60,396 |
| | Conservative | Pierre Breton | 8,374 | 27.0 | +8.0 | $57,909 |
| | Liberal | Randy Jones | 4,737 | 15.3 | +1.0 | $3,407 |
| | New Democratic | Michaël Chicoine | 1,491 | 4.8 | -8.0 | $228 |
| | Green | Jacques Gélineau | 1,112 | 3.6 | +1.3 | |
| Total valid votes/Expense limit | 30,986 | 100.0 | $99,164 |
| Total rejected ballots | 444 | 1.4 |
| Turnout | 31,430 | – |
| 2006 Canadian federal election |
| Party | Candidate | Votes | % | | Expenditures |
| | Bloc Québécois | Gérard Asselin | 18,601 | 51.1 | -7.4 | $59,792 |
| | Conservative | Pierre Paradis | 6,910 | 19.0 | +14.1 | $9,560 |
| | Liberal | Randy Jones | 5,214 | 14.3 | -10.6 | $22,979 |
| | New Democratic | Pierre Ducasse | 4,657 | 12.8 | +2.5 | $20,006 |
| | Green | Jacques Gélineau | 824 | 2.3 | +0.9 | |
| | Independent | Eric Viver | 195 | 0.5 | – | |
| Total valid votes/Expense limit | 36,401 | 100.0 | $92,367 |
| 2004 Canadian federal election |
| Party | Candidate | Votes | % | | Expenditures |
| | Bloc Québécois | Gérard Asselin | 19,040 | 58.5 | +5.3 | $55,212 |
| | Liberal | Anthony Detroio | 8,097 | 24.9 | -10.8 | $54,120 |
| | New Democratic | Pierre Ducasse | 3,361 | 10.3 | +8.6 | $23,174 |
| | Conservative | Pierre Paradis | 1,601 | 4.9 | -4.4[fn 2] | $4,449 |
| | Green | Les Parsons | 444 | 1.4 | – | $905 |
| Total valid votes/Expense limit | 32,543 | 100.0 | $90,297 |
| 1980 Canadian federal election |
| Party | Candidate | Votes | % | |
| | Liberal | André Maltais | 21,499 | 68.6 | 10.0 |
| | Progressive Conservative | Jacques Blouin | 4,844 | 15.5 | -0.2 |
| | New Democratic | Roger Muller | 2,111 | 6.7 | +0.1 |
| | Social Credit | Marcel Brin | 1,184 | 3.8 | -13.2 |
| | Rhinoceros | Yves Truchon | 841 | 2.7 | |
| | Rhinoceros | Denis Tarzan Bédard | 715 | 2.3 | |
| | Marxist–Leninist | Lisette Paradis | 125 | 0.4 | |
| Total valid votes | 31,319 | 100.0 |
| 1974 Canadian federal election |
| Party | Candidate | Votes | % | |
| | Liberal | Gustave Blouin | 16,220 | 67.2 | +10.7 |
| | Progressive Conservative | Alban Malenfant | 4,024 | 16.7 | +1.1 |
| | New Democratic | Raymond Perron | 3,247 | 13.4 | +6.2 |
| | Marxist–Leninist | Gilles Verrier | 659 | 2.7 | |
| Total valid votes | 24,150 | 100.0 |
See also
Notes
- ^ André Forbes was nominated as a Liberal, but lost party support just before the nomination deadline. Instead of resigning, he continued to run as an Independent. He appears on the ballot as a Liberal.[9][10]
- ^ Conservative vote is compared to the total of the Canadian Alliance vote and Progressive Conservative vote in 2000 election.
- ^ No BQ candidate in 1988 for comparison.
References
Notes
)