Sheffield Heeley is a constituency[n 1] represented in the House of Commons of the UK Parliament since 2015 by Louise Haigh, a member of the Labour Party.[n 2] It is located in the city of Sheffield, South Yorkshire.
History
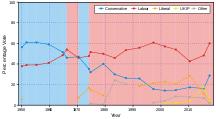
This seat was created in 1950, largely replacing the former Sheffield Ecclesall constituency, its boundaries being significantly altered in 1955 with the abolition of Sheffield Neepsend. At its first five elections, up to but excluding 1966, the seat was won by a Conservative, Peter Roberts; it changed hands three times between 1966 and 1974.
Against the national swing, the 1979 election saw Sheffield Heeley move from being a marginal Labour seat to having a solid Labour majority. Of the subsequent elections, only the 1983 and 2010 results have been fairly marginal; the others have suggested a safe Labour seat. At the 2010 election the Liberal Democrat had more than a quarter of the vote, whereas the Conservatives, on 17.3%, garnered 3% more votes than in 2005.[n 3]
Boundaries
1950–1955: The County Borough of Sheffield wards of Heeley, Nether Edge, Norton, and Woodseats.
1955–1974: The County Borough of Sheffield wards of Heeley, Nether Edge, Norton, Sharrow, and Woodseats.
1974–1983: The County Borough of Sheffield wards of Beauchief, Gleadless, Heeley, and Intake.
1983–2010: The City of Sheffield wards of Beauchief, Heeley, Intake, Norton, and Park.
2010–present: The City of Sheffield wards of Arbourthorne, Beauchief and Greenhill, Gleadless Valley, Graves Park, and Richmond.
Constituency profile
This constituency has a moderate Labour majority ,and contains a mixture of urban areas. In 2010 the BNP, unusually in Britain, achieved more than the 5% share of the vote necessary to recover the election deposit; its 5.5% share was a record in Sheffield.
The constituency consists of Census Output Areas a local government districts with: a working population whose income is marginally below the national average, and that has close to average reliance upon social housing.[2] At the end of 2012, 5.7% of the population was claiming Jobseekers Allowance, compared to the regional average of 4.7%.[3] The district contributing to the seat has a medium 33% of its population without a car.[n 4] A medium 24.3% of the City's population are without qualifications, a high 15.8% of the population with level 3 qualifications and a medium 25.7% with level 4 qualifications or above. In terms of tenure, as of the 2011 census, a relatively low 58.3% of homes were owned outright or on a mortgage by occupants across the district.[4]
Members of Parliament
Elections
Heeley general election results
Elections in the 2010s
General election 2019: Sheffield Heeley[5] | Party | Candidate | Votes | % | |
| | Labour | Louise Haigh | 21,475 | 50.3 | -9.7 |
| | Conservative | Gordon Gregory | 12,955 | 30.3 | +1.6 |
| | Brexit Party | Tracy Knowles | 3,538 | 8.3 | New |
| | Liberal Democrats | Simon Clement-Jones | 2,916 | 6.8 | +2.2 |
| | Green | Paul Turpin | 1,811 | 4.2 | +2.1 |
| Majority | 8,520 | 20.0 | -11.3 |
| Turnout | 42,695 | 63.8 | -1.3 |
| | Labour hold | Swing | -5.6 | |
General election 2017: Sheffield Heeley[6] | Party | Candidate | Votes | % | |
| | Labour | Louise Haigh | 26,524 | 60.0 | +11.8 |
| | Conservative | Gordon Gregory | 12,696 | 28.7 | +12.5 |
| | Liberal Democrats | Joe Otten | 2,022 | 4.6 | -6.7 |
| | UKIP | Howard Denby | 1,977 | 4.5 | -12.9 |
| | Green | Declan Walsh | 943 | 2.1 | -4.0 |
| | SDP | Jaspreet Oberoi | 64 | 0.1 | New |
| Majority | 13,828 | 31.3 | +0.5 |
| Turnout | 44,226 | 65.1 | +0.4 |
| | Labour hold | Swing | -0.4 | |
General election 2015: Sheffield Heeley[7][8] | Party | Candidate | Votes | % | |
| | Labour | Louise Haigh | 20,269 | 48.2 | +5.6 |
| | UKIP | Howard Denby | 7,315 | 17.4 | +13.7 |
| | Conservative | Stephen Castens | 6,792 | 16.2 | -1.1 |
| | Liberal Democrats | Simon Clement-Jones | 4,746 | 11.3 | -17.1 |
| | Green | Rita Wilcock | 2,566 | 6.1 | +3.7 |
| | TUSC | Alan Munro | 238 | 0.6 | New |
| | English Democrat | David Haslett | 122 | 0.3 | New |
| Majority | 12,954 | 30.8 | +16.6 |
| Turnout | 42,048 | 60.7 | -1.3 |
| | Labour hold | Swing | | |
General election 2010: Sheffield Heeley[9] | Party | Candidate | Votes | % | |
| | Labour | Meg Munn | 17,409 | 42.6 | -11.5 |
| | Liberal Democrats | Simon Clement-Jones | 11,602 | 28.4 | +7.0 |
| | Conservative | Anne Crampton | 7,081 | 17.3 | +3.0 |
| | BNP | John Beatson | 2,260 | 5.5 | +2.1 |
| | UKIP | Charlotte Arnott | 1,530 | 3.7 | +1.4 |
| | Green | Gareth Roberts | 989 | 2.4 | -1.2 |
| Majority | 5,807 | 14.2 | -19.5 |
| Turnout | 40,871 | 62.0 | +4.3 |
| | Labour Co-op hold | Swing | -9.25 | |
Elections in the 2000s
- General election of 2005
- General election of 2001
Elections in the 1990s
- General election of 1997
- General election of 1992
General election 1992: Sheffield Heeley[13] | Party | Candidate | Votes | % | |
| | Labour | Bill Michie | 28,005 | 55.7 | +2.3 |
| | Conservative | David Beck | 13,051 | 25.9 | -0.4 |
| | Liberal Democrats | Peter Moore | 9,247 | 18.4 | -1.9 |
| Majority | 14,954 | 29.8 | +2.7 |
| Turnout | 50,303 | 70.9 | -1.1 |
| | Labour hold | Swing | | |
Elections in the 1980s
- General election of 1983
Elections in the 1970s
- General election of 1979
General election 1979: Sheffield Heeley | Party | Candidate | Votes | % | |
| | Labour | Frank Hooley | 24,618 | 49.8 | -1.8 |
| | Conservative | Danny George | 19,845 | 40.1 | +8.1 |
| | Liberal | Rodney Webb | 4,708 | 9.5 | -5.4 |
| | National Front | P. K. Thorpe | 274 | 0.6 | -0.9 |
| Majority | 4,773 | 9.7 | -9.9 |
| Turnout | 49,445 | 77.3 | +3.8 |
| | Labour hold | Swing | | |
- General election of October 1974
General election October 1974: Sheffield Heeley | Party | Candidate | Votes | % | |
| | Labour | Frank Hooley | 24,728 | 51.6 | +3.9 |
| | Conservative | Alan Page | 15,322 | 32.0 | -3.3 |
| | Liberal | Royden Fairfax | 7,151 | 14.9 | -2.1 |
| | National Front | Peter Revell | 723 | 1.5 | New |
| Majority | 9,406 | 19.6 | +7.2 |
| Turnout | 47,924 | 73.5 | -8.5 |
| | Labour hold | Swing | | |
- General election of February 1974
- General election of 1970
Elections in the 1960s
- General election of 1966
- General election of 1964
Elections in the 1950s
- General election of 1959
General election 1959: Sheffield Heeley[16] | Party | Candidate | Votes | % | |
| | Conservative and National Liberal | Peter Roberts | 33,236 | 59.0 | -1.9 |
| | Labour | Joan Mellors | 23,109 | 41.0 | +1.9 |
| Majority | 10,127 | 18.0 | -3.8 |
| Turnout | 56,345 | 77.6 | +0.6 |
| | Conservative and National Liberal hold | Swing | | |
- General election of 1955
General election 1955: Sheffield Heeley[17] | Party | Candidate | Votes | % | |
| | Conservative and National Liberal | Peter Roberts | 30,798 | 60.9 | -0.1 |
| | Labour | John Sewell | 19,747 | 39.1 | +0.1 |
| Majority | 11,051 | 21.8 | -0.2 |
| Turnout | 50,545 | 77.0 | -7.6 |
| | Conservative and National Liberal hold | Swing | | |
- General election of 1951
General election 1951: Sheffield Heeley[18] | Party | Candidate | Votes | % | |
| | Conservative and National Liberal | Peter Roberts | 27,776 | 61.0 | +4.7 |
| | Labour | Arnold Jennings | 17,729 | 39.0 | +1.2 |
| Majority | 10,047 | 22.0 | +3.5 |
| Turnout | 45,505 | 84.6 | -3.5 |
| | Conservative and National Liberal hold | Swing | | |
- General election of 1950
General election 1950: Sheffield Heeley[19] | Party | Candidate | Votes | % | |
| | Conservative and National Liberal | Peter Roberts | 26,560 | 56.3 | |
| | Labour | Arnold Jennings | 17,856 | 37.8 | |
| | Liberal | Phillip Beckerlegge | 2,779 | 5.9 | |
| Majority | 8,704 | 18.5 | |
| Turnout | 47,195 | 88.1 | |
| | Conservative and National Liberal win (new seat) |
See also
Notes and references
- Notes
- ^ A borough constituency (for the purposes of election expenses and type of returning officer)
- ^ As with all constituencies, the constituency elects one Member of Parliament (MP) by the first past the post system of election at least every five years.
- ^ The 8th different candidate, one for each election, since 1979.
- ^ This falls within the centrally coloured banding for metropolitan areas
- References
External links
)
)
)