| Nottingham North |
|---|
Borough constituency
for the House of Commons |
 Boundary of Nottingham North in Nottinghamshire |
 Location of Nottinghamshire within England |
| County | Nottinghamshire |
|---|
| Electorate | 64,578 (December 2010) |
|---|
| Major settlements | Bulwell |
|---|
| Current constituency |
|---|
| Created | 1955 |
|---|
| Member of Parliament | Alex Norris (Labour Co-op) |
|---|
| Created from | Nottingham East, Nottingham West and Broxtowe |
|---|
Nottingham North is a constituency[n 1] represented in the House of Commons of the UK Parliament since 2017 by Alex Norris of the Labour and Co-operative party.[n 2]
Boundaries
1955–1974: The County Borough of Nottingham wards of Byron, Mapperley, Portland, and St Albans, and the Urban District of Hucknall.
1974–1983: The County Borough of Nottingham wards of Byron, Forest, Mapperley, Portland, Radford, and St Albans.
1983–2010: The City of Nottingham wards of Aspley, Beechdale, Bestwood Park, Bilborough, Bulwell East, Bulwell West, Byron, Portland, and Strelley.
2010–present: The City of Nottingham wards of Aspley, Basford, Bestwood, Bilborough, Bulwell, and Bulwell Forest.
Constituency profile
The constituency consists mostly of residential areas, a majority of neighbourhoods of which were council housing. Of these a slight majority, rather than being social housing, is now private under the Right to Buy, such as Bulwell. Overall, its census Super Output Areas have the lowest income of the three Nottingham constituencies,[1] and was the city's safest seat for the Labour Party, though 2017 and 2019 saw considerable increases in the Conservative vote, in line with other Leave and heavily working-class areas, making this seat now Nottingham's most marginal for Labour. Male unemployment in 2010 was significantly higher than female unemployment in this constituency, which had the highest overall percentage of claimants in the county of Nottinghamshire, slightly more than Nottingham East.[2]
- Causes of Unemployment
The decline of coal mining and the textile industry in the area in 1970–2000 brought the highest unemployment in the county to Nottingham North, with a peak of 12.8% of its residents being registered unemployed in 2009.
History
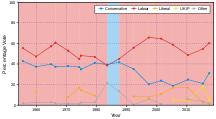
The constituency was created in 1955 and elected Labour candidates as MPs until Richard Ottaway[n 3] surprisingly gained it for the Conservative Party in their landslide victory of 1983, before narrowly losing in 1987 to Graham Allen, for Labour, who held it until 2017 when he stood down after 30 years of service. Alex Norris then won the seat for Labour in the 2017 general election.
Members of Parliament
Elections
Election results for Nottingham North
Elections in the 2010s
General election 2019: Nottingham North[4] | Party | Candidate | Votes | % | |
| | Labour Co-op | Alex Norris | 17,337 | 49.1 | -11.1 |
| | Conservative | Stuart Bestwick | 12,847 | 36.4 | +5.3 |
| | Brexit Party | Julian Carter | 2,686 | 7.6 | New |
| | Liberal Democrats | Christina Morgan-Danvers | 1,583 | 4.5 | +2.7 |
| | Green | Andrew Jones | 868 | 2.5 | +1.1 |
| Majority | 4,490 | 12.7 | -4.4 |
| Turnout | 35,320 | 53.1 | -4.2 |
| | Labour Co-op hold | Swing | -8.2 | |
General election 2017: Nottingham North[5] | Party | Candidate | Votes | % | |
| | Labour Co-op | Alex Norris | 23,067 | 60.2 | +5.6 |
| | Conservative | Jack Tinley | 11,907 | 31.1 | +10.1 |
| | UKIP | Stephen Crosby | 2,133 | 5.6 | -12.9 |
| | Liberal Democrats | Tadeusz Jones | 674 | 1.8 | -0.6 |
| | Green | Kirsty Jones | 538 | 1.4 | -1.7 |
| Majority | 11,160 | 29.1 | -4.5 |
| Turnout | 38,319 | 57.3 | +3.7 |
| | Labour hold | Swing | -2.3 | |
General election 2015: Nottingham North[6][7] | Party | Candidate | Votes | % | |
| | Labour | Graham Allen | 19,283 | 54.6 | +6.0 |
| | Conservative | Louise Burfitt-Dons | 7,423 | 21.0 | −3.8 |
| | UKIP | Stephen Crosby[8] | 6,542 | 18.5 | +14.6 |
| | Green | Katharina Boettge[9] | 1,088 | 3.1 | +3.1 |
| | Liberal Democrats | Tony Sutton | 847 | 2.4 | −14.7 |
| | TUSC | Cathy Meadows | 160 | 0.5 | New |
| Majority | 11,860 | 33.6 | +9.8 |
| Turnout | 34,285 | 53.6 | −0.6 |
| | Labour hold | Swing | +4.9 | |
Class War Party originally announced Ben Turff as candidate, but he failed to stand.[10]
General election 2010: Nottingham North[11][12] | Party | Candidate | Votes | % | |
| | Labour | Graham Allen | 16,648 | 48.6 | −10.6 |
| | Conservative | Martin Curtis | 8,508 | 24.8 | +6.7 |
| | Liberal Democrats | Tim Ball | 5,849 | 17.1 | −0.3 |
| | BNP | Simon Brindley | 1,944 | 5.7 | New |
| | UKIP | Irenea Marriott | 1,338 | 3.9 | −1.5 |
| Majority | 8,138 | 23.8 | |
| Turnout | 34,285 | 54.2 | +5.8 |
| | Labour hold | Swing | −8.7 | |
Elections in the 2000s
General election 2005: Nottingham North[13][14] | Party | Candidate | Votes | % | |
| | Labour | Graham Allen | 17,842 | 58.7 | −5.8 |
| | Conservative | Priti Patel | 5,671 | 18.7 | −5.1 |
| | Liberal Democrats | Tim Ball | 5,190 | 17.1 | +6.5 |
| | UKIP | Irena Marriott | 1,680 | 5.5 | New |
| Majority | 12,171 | 40.0 | -0.7 |
| Turnout | 30,383 | 49.1 | +2.4 |
| | Labour hold | Swing | −0.3 | |
General election 2001: Nottingham North[15][16] | Party | Candidate | Votes | % | |
| | Labour | Graham Allen | 19,392 | 64.5 | −1.2 |
| | Conservative | Martin Wright | 7,152 | 23.8 | +3.5 |
| | Liberal Democrats | Rob Lee | 3,177 | 10.6 | +2.6 |
| | Socialist Labour | Andrew Botham | 321 | 1.1 | New |
| Majority | 12,240 | 40.7 | -4.7 |
| Turnout | 30,042 | 46.7 | −16.3 |
| | Labour hold | Swing | −2.3 | |
Elections in the 1990s
General election 1997: Nottingham North[17][16] | Party | Candidate | Votes | % | |
| | Labour | Graham Allen | 27,203 | 65.7 | +10.0 |
| | Conservative | Gillian Shaw | 8,402 | 20.3 | -14.8 |
| | Liberal Democrats | Rachel Oliver | 3,301 | 8.0 | -0.6 |
| | Referendum | Joe Neal | 1,858 | 4.5 | New |
| | Socialist Alternative | Andy Belfield | 637 | 1.5 | New |
| Majority | 18,801 | 45.4 | +24.8 |
| Turnout | 41,401 | 63.0 | -12.0 |
| | Labour hold | Swing | | |
General election 1992: Nottingham North[18][19] | Party | Candidate | Votes | % | |
| | Labour | Graham Allen | 29,052 | 55.7 | +10.8 |
| | Conservative | Ian G. Bridge | 18,309 | 35.1 | −6.5 |
| | Liberal Democrats | Anthony Skelton | 4,477 | 8.6 | −3.1 |
| | Natural Law | Alwyn C. Cadman | 274 | 0.5 | New |
| Majority | 10,743 | 20.6 | +17.3 |
| Turnout | 52,112 | 75.0 | +2.4 |
| | Labour hold | Swing | +8.7 | |
Elections in the 1980s
Elections in the 1970s
(Boundary changes for 1974)
Elections in the 1960s
Elections in the 1950s
See also
Notes and references
- Notes
- ^ A borough constituency (for the purposes of election expenses and type of returning officer)
- ^ As with all constituencies, the constituency elects one Member of Parliament (MP) by the first past the post system of election at least every five years.
- ^ MP for Croydon South 1992–2015
- References
)
)
)