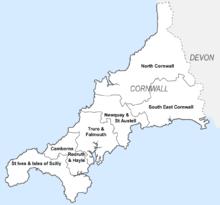
Sketchmap of 2010 parliamentary constituencies in Cornwall - click to enlarge
The North Cornwall constituency shown within Cornwall and Devon, 1918-1945
North Cornwall is a constituency[n 1] represented in the House of Commons of the UK Parliament by Scott Mann, a Conservative since the 2015 general election. Like all British constituencies, the seat elects one Member of Parliament (MP) by the first past the post system of election at least every five years. The seat was created in 1918. Since 1950, the constituency has been held by MPs from either the Conservative Party or the Liberal Democrats (including the party's predecessor, the Liberal Party).
History
This constituency was created under the Representation of the People Act 1918.[2]
With exceptions in 1997 and 2001 the seat's margin of victory has been less than 20% of the vote; it has been consistently fought over between and won by the Conservative Party and the Liberal Democrats's candidate (or predecessor party in the latter case), and can be considered a marginal seat. In 1997 and 2001 the seat turned out strongly overall for the latter party. However, in the 2019 general election, the Conservatives won a large majority of 28.6% over the Liberal Democrat candidate.
A third-placed (other party) candidate has not polled more in North Cornwall than 16.38%, which took place in 1951. The seat saw three years of defection of its Liberal MP to join the post-World War II Attlee Ministry however in 2015 saw the lowest share of the Labour Party's vote nationally – reinforcing a consistent result by a great majority supporting left-wing politics to vote for a Liberal and later Liberal Democrat at general elections since the seat's inception.
Boundaries
1918–1950: The Borough of Launceston, the Urban Districts of Newquay, Padstow, Stratton and Bude, and Wadebridge, the Rural Districts of Calstock, Camelford, Launceston, St Columb Major, and Stratton, and parts of the Rural Districts of Bodmin and Holsworthy (these areas such as Whitstone and Week St Mary were on the Cornish side of the border).
1950–1974: The Borough of Launceston, the Urban Districts of Bude-Stratton, Newquay, and Padstow, the Rural Districts of Camelford, Launceston, and Stratton, and parts of the Rural Districts of St Austell and Wadebridge.
1974–1983: The Borough of Launceston, the Urban Districts of Bude-Stratton and Newquay, the Rural Districts of Camelford, Launceston, and Stratton, and parts of the Rural Districts of St Austell, and Wadebridge and Padstow.
1983–2010: The District of North Cornwall wards of Allan, Altarnun, Bodmin St Mary's, Bodmin St Petroc, Bude and Poughill, Camelford, Grenville, Lanivet, Launceston North, Launceston South, Lesnewth, North Petherwin, Ottery, Padstow and St Merryn, Penfound, Rumford, St Breward, St Endellion, St Minver, St Teath, South Petherwin, Stratton, Tintagel, Trigg, Wadebridge, and Week St Mary, and the Borough of Restormel wards of Edgcumbe, Gannel, Rialton, St Columb, and St Enoder.
2010–present: The District of North Cornwall.
Historically four borough constituencies lay within the boundaries, three of which were abolished as 'rotten boroughs' by the Great Reform Act, 1832:
Members of Parliament
Elections
North Cornwall electoral history
Elections in the 2010s
General election 2019: North Cornwall[4] | Party | Candidate | Votes | % | |
| | Conservative | Scott Mann | 30,671 | 59.4 | +8.7 |
| | Liberal Democrats | Danny Chambers | 15,919 | 30.8 | −5.8 |
| | Labour | Joy Bassett | 4,516 | 8.7 | −3.3 |
| | Liberal | Elmars Liepins | 572 | 1.1 | +1.1 |
| Majority | 14,752 | 28.5 | +14.4 |
| Turnout | 51,678 | 73.9 | −0.1 |
| | Conservative hold | Swing | +7.3 | |
General election 2015: North Cornwall[6] | Party | Candidate | Votes | % | |
| | Conservative | Scott Mann | 21,689 | 45.0 | +3.3 |
| | Liberal Democrats | Dan Rogerson | 15,068 | 31.2 | −16.8 |
| | UKIP | Julie Lingard | 6,121 | 12.7 | +7.8 |
| | Labour | John Whitby | 2,621 | 5.4 | +1.2 |
| | Green | Amanda Pennington | 2,063 | 4.3 | +4.3 |
| | Mebyon Kernow | Jerry Jefferies | 631 | 1.3 | +0.2 |
| | Restore the Family for Children's Sake | John Allman | 52 | 0.1 | +0.1 |
| Majority | 6,621 | 13.7 | +0.9 |
| Turnout | 48,245 | 71.8 | +3.6 |
| | Conservative gain from Liberal Democrats | Swing | +10.05 | |
General election 2010: North Cornwall[7][8] | Party | Candidate | Votes | % | |
| | Liberal Democrats | Dan Rogerson | 22,512 | 48.1 | +5.7 |
| | Conservative | Sian Flynn | 19,531 | 41.7 | +6.3 |
| | UKIP | Miriel O'Connor | 2,300 | 4.9 | −0.8 |
| | Labour | Janet Hulme | 1,971 | 4.2 | −8.3 |
| | Mebyon Kernow | Joanie Willet | 530 | 1.1 | −2.1 |
| Majority | 2,981 | 6.4 | +0.9 |
| Turnout | 46,844 | 68.2 | +3.7 |
| | Liberal Democrats hold | Swing | −0.3 | |
Elections in the 2000s
General election 2001: North Cornwall[10] | Party | Candidate | Votes | % | |
| | Liberal Democrats | Paul Tyler | 28,082 | 52.0 | −1.1 |
| | Conservative | John Weller | 18,250 | 33.8 | +4.3 |
| | Labour | Michael Goodman | 5,257 | 9.7 | +0.3 |
| | UKIP | Steve Protz | 2,394 | 4.4 | N/A |
| Majority | 9,832 | 18.2 | -5.5 |
| Turnout | 53,983 | 63.8 | −9.3 |
| | Liberal Democrats hold | Swing | −2.7 | |
Elections in the 1990s
General election 1997: North Cornwall[11] | Party | Candidate | Votes | % | |
| | Liberal Democrats | Paul Tyler | 31,100 | 53.2 | +5.8 |
| | Conservative | Nigel Linacre | 17,253 | 29.5 | −14.8 |
| | Labour | Anne Lindo | 5,523 | 9.4 | +2.9 |
| | Referendum | Felicity Odam | 3,636 | 6.2 | N/A |
| | Mebyon Kernow | John Bolitho | 645 | 1.1 | N/A |
| | Liberal | Rif Winfield | 186 | 0.3 | −0.8 |
| | Natural Law | Nicholas Creswell | 152 | 0.3 | +0.1 |
| Majority | 13,847 | 23.7 | |
| Turnout | 58,495 | 73.05 | |
| | Liberal Democrats hold | Swing | +10.3[n 4] | |
Elections in the 1980s
Elections in the 1970s
- February 1974; new constituency boundaries applied.
Elections in the 1960s
Elections in the 1950s
Elections in the 1940s
General election 1945: Cornwall North | Party | Candidate | Votes | % | |
| | Liberal | Tom Horabin | 18,836 | 52.9 | +0.7 |
| | Conservative | Thomas Percy Fulford | 16,171 | 45.4 | -2.4 |
| | Independent Labour | John Hazlewood Worrall | 626 | 1.8 | +1.8 |
| Majority | 2,665 | 7.5 | +3.1 |
| Turnout | 35,633 | 72.7 | -6.6 |
| | Liberal hold | Swing | | |
Elections in the 1930s
1935 general election: North Cornwall | Party | Candidate | Votes | % | |
| | Liberal | Francis Dyke Acland | 16,872 | 51.3 | -1.1 |
| | Conservative | Edward Robin Whitehouse | 16,036 | 48.7 | +1.1 |
| Majority | 836 | 2.6 | -2.2 |
| Turnout | 32,908 | 79.9 | -0.9 |
| | Liberal hold | Swing | -1.1 | |
1932 North Cornwall by-election | Party | Candidate | Votes | % | |
| | Liberal | Francis Dyke Acland | 16,933 | 52.4 | +3.3 |
| | Conservative | Alfred Martyn Williams | 15,387 | 47.6 | +2.3 |
| Majority | 1,546 | 4.8 | +1.0 |
| Turnout | 32,320 | 80.8 | -4.9 |
| | Liberal hold | Swing | | |
- Death of Maclean 15 June 1932
1931 general election: North Cornwall | Party | Candidate | Votes | % | |
| | Liberal | Donald Maclean | 16,867 | 49.1 | -0.6 |
| | Conservative | Alfred Martyn Williams | 16,526 | 45.3 | +3.0 |
| | Labour | Arthur Bennett | 1,907 | 5.6 | -2.4 |
| Majority | 1,341 | 3.8 | -3.6 |
| Turnout | 35,300 | 85.7 | -0.4 |
| | Liberal hold | Swing | | |
Elections in the 1920s
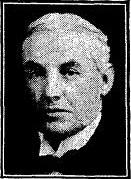
Sir Donald Maclean
1929 general election: North Cornwall | Party | Candidate | Votes | % | |
| | Liberal | Donald Maclean | 16,586 | 49.7 | +3.3 |
| | Unionist | Alfred Martyn Williams | 14,095 | 42.3 | -11.3 |
| | Labour | F. E. Church | 2,654 | 8.0 | n/a |
| Majority | 2,491 | 7.4 | 14.6 |
| Turnout | 33,335 | 86.1 | +8.1 |
| | Liberal gain from Unionist | Swing | +7.3 | |
General election 1924: North Cornwall | Party | Candidate | Votes | % | |
| | Unionist | Alfred Martyn Williams | 12,639 | 53.6 | +10.1 |
| | Liberal | George Marks | 10,927 | 46.4 | -10.1 |
| Majority | 1,712 | 7.2 | 20.2 |
| Turnout | 23,566 | 78.0 | |
| | Unionist gain from Liberal | Swing | | |
General election 1923: North Cornwall | Party | Candidate | Votes | % | |
| | Liberal | George Marks | 12,434 | 56.5 | n/a |
| | Unionist | Charles Alexander Petrie | 9,581 | 43.5 | n/a |
| Majority | 2,853 | 13.0 | n/a |
| Turnout | 22,015 | 75.6 | n/a |
| | Liberal hold | Swing | n/a | |
General election 1922: North Cornwall | Party | Candidate | Votes | % | |
| | National Liberal | George Marks | unopposed | n/a | n/a |
| | National Liberal hold | Swing | n/a | |
Elections in the 1910s
General election 1918: North Cornwall | Party | Candidate | Votes | % | |
| C | Liberal | George Marks | Unopposed |
| | Liberal win (new seat) |
| C indicates candidate endorsed by the coalition government. |
See also
Notes and references
- ^ A county constituency (for the purposes of election expenses and type of returning officer)
- ^ Knighted in 1991
- ^ Granted a peerage in 2005
- ^ The largest two-party swing in this election was (Con-Ref): 10.5%
References
Sources
- British Parliamentary Election Results 1918-1949, compiled and edited by F.W.S. Craig (Macmillan Press 1977)
)
)
)
)

