Newport was a borough constituency in Monmouthshire from 1918 to 1983. It returned one Member of Parliament (MP) to the House of Commons of the Parliament of the United Kingdom, elected by the first past the post system.
The constituency was created by the Representation of the People Act 1918 and abolished with the creation of the Newport East and Newport West constituencies. The Representation of the People Act enfranchised the county borough of Newport as a parliamentary borough returning one member. Previously, the borough was represented as part of the Monmouth Boroughs constituency, which also covered Monmouth and Usk.
Boundaries
1918–1955: The County Borough of Newport.
1955–1983: As above, as extended by the Newport Corporation Act 1954.
Members of Parliament
Election results
Elections in the 1910s
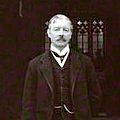
Lewis Haslam
General election 1918: Newport | Party | Candidate | Votes | % | |
| C | Liberal | Lewis Haslam | 14,080 | 56.4 | |
| | Labour | William Bowen | 10,234 | 41.0 | |
| | Independent Democrat | Bertie Pardoe-Thomas [1] | 647 | 2.6 | |
| Majority | 3,846 | 15.4 | |
| Turnout | 24,961 | 62.2 | |
| | Liberal win (new seat) |
| C indicates candidate endorsed by the coalition government. |
Elections in the 1920s
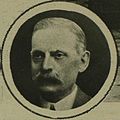
Lynden Moore
1922 Newport by-election: Newport | Party | Candidate | Votes | % | |
| | Unionist | Reginald Clarry | 13,515 | 40.0 | New |
| | Labour | William Bowen | 11,425 | 33.8 | -7.2 |
| | Liberal | William Moore | 8,841 | 26.2 | -30.2 |
| Majority | 2,090 | 6.2 | N/A |
| Turnout | 33,781 | 79.2 | +17.0 |
| | Unionist gain from Coalition Liberal | Swing | | |
- Clarry stood on a platform of opposition to the Coalition Government. Moore was also opposed to the Coalition and called for a reunited Liberal Party.
General election 1922: Newport | Party | Candidate | Votes | % | |
| | Unionist | Reginald Clarry | 19,019 | 54.3 | N/A |
| | Labour | William Bowen | 16,000 | 45.7 | +4.7 |
| Majority | 3,019 | 8.6 | +2.4 |
| Turnout | 35,019 | 82.1 | +19.9 |
| | Unionist gain from Liberal | Swing | | |
General election 1923: Newport | Party | Candidate | Votes | % | |
| | Unionist | Reginald Clarry | 14,424 | 39.5 | -14.8 |
| | Labour | William Bowen | 14,100 | 38.6 | -7.1 |
| | Liberal | H. Davies | 8,015 | 21.9 | New |
| Majority | 324 | 0.9 | -7.7 |
| Turnout | 36,539 | 85.2 | +3.1 |
| | Unionist hold | Swing | -3.8 | |
General election 1924: Newport | Party | Candidate | Votes | % | |
| | Unionist | Reginald Clarry | 20,426 | 52.8 | +13.3 |
| | Labour | William Bowen | 18,263 | 47.2 | +9.6 |
| Majority | 2,163 | 5.6 | +4.7 |
| Turnout | 38,689 | 85.7 | +0.5 |
| | Unionist hold | Swing | | |
Elections in the 1930s
Elections in the 1940s
Elections in the 1950s
Elections in the 1960s
Elections in the 1970s
General election 1970: Newport | Party | Candidate | Votes | % | |
| | Labour | Roy Hughes | 30,132 | 55.7 | -4.1 |
| | Conservative | Anthony D. Arnold | 22,005 | 40.7 | +0.5 |
| | Plaid Cymru | A. Robert Vickery | 1,997 | 3.7 | New |
| Majority | 10,499 | 15.0 | -4.6 |
| Turnout | 54,134 | 75.5 | -3.3 |
| | Labour hold | Swing | | |
General election February 1974: Newport | Party | Candidate | Votes | % | |
| | Labour | Roy Hughes | 29,384 | 48.8 | -6.9 |
| | Conservative | G. Price | 18,002 | 29.9 | -10.8 |
| | Liberal | J. H. Morgan | 11,868 | 19.7 | New |
| | Plaid Cymru | P. Cox | 936 | 1.6 | -2.1 |
| Majority | 11,382 | 18.9 | +3.9 |
| Turnout | 60,190 | 81.0 | +5.5 |
| | Labour hold | Swing | | |
General election October 1974: Newport | Party | Candidate | Votes | % | |
| | Labour | Roy Hughes | 30,069 | 53.0 | +4.2 |
| | Conservative | G. A. L. Price | 16,253 | 28.6 | -1.3 |
| | Liberal | J. H. Morgan | 9,207 | 16.2 | -3.5 |
| | Plaid Cymru | G. Lee | 1,216 | 2.1 | +0.5 |
| Majority | 13,816 | 22.4 | +5.5 |
| Turnout | 56,745 | 75.6 | -4.4 |
| | Labour hold | Swing | | |
General election 1979: Newport | Party | Candidate | Votes | % | |
| | Labour | Roy Hughes | 30,919 | 51.7 | -1.3 |
| | Conservative | G. G. Davies | 21,742 | 36.3 | +7.7 |
| | Liberal | A. Lambert | 6,270 | 10.5 | -5.7 |
| | National Front | G. R. Woodward | 484 | 0.8 | New |
| | Plaid Cymru | A. Robert Vickery | 473 | 0.8 | -1.3 |
| Majority | 9,177 | 15.3 | -9.1 |
| Turnout | 59,888 | 79.7 | +4.1 |
| | Labour hold | Swing | | |
See also
- 1922 Newport by-election
- 1945 Newport by-election
- 1956 Newport by-election
References
- ^ ‘PARDOE-THOMAS, Bertie’, Who Was Who, A & C Black, an imprint of Bloomsbury Publishing plc, 1920–2016; online edn, Oxford University Press, 2014 ; online edn, April 2014 accessed 18 Sept 2017
- ^ British Parliamentary Election Results 1918-1949, FWS Craig
Sources
)
)