)
Indiana is a state located in the Midwestern United States. As of the 2019 census estimate, the state had 6,732,219 residents.
Under Indiana law, a municipality must have a minimum of 2,000 people to incorporate as a city. Except as noted, all cities are "third-class" cities with a seven-member city council and an elected clerk-treasurer. "Second-class" cities had a population of at least 35,000 and up to 600,000 at time of designation, and have a nine-member city council and an elected clerk. Indianapolis is the only "first-class" city in Indiana under state law, making it subject to a consolidated city-county government known as Unigov.
- Twelve largest cities in Indiana
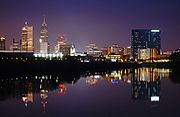
1 - Indianapolis, capital and largest city of Indiana

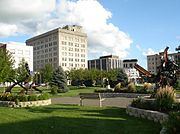
2 - Fort Wayne
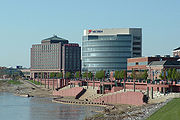
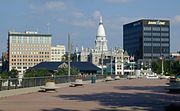
3 - Evansville

4 - South Bend
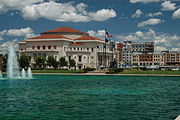
5 - Carmel
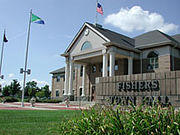
6 - Fishers
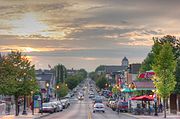
7 - Bloomington
8 - Hammond
9 - Gary
10 - Lafayette

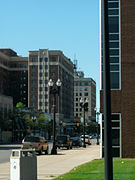
11 - Muncie
12 - Noblesville
)
)
)
)
)
)
)
)
)
)
)
)
| 2018 Rank | City | 2019 Estimate[1] | 2010 Census[2] | Change | County | Land Area | Density |
|---|---|---|---|---|---|---|---|
| 1 | Indianapolis | 876,384 | 820,445 | +6.82% | Marion | 361.51 sq mi (936.30 km2) | 2,388/sq mi (922/km2) |
| 2 | Fort Wayne | 270,402 | 253,691 | +6.59% | Allen | 110.62 sq mi (286.5 km2) | 2,404/sq mi (928/km2) |
| 3 | Evansville | 117,979 | 117,429 | +0.47% | Vanderburgh | 44.15 sq mi (114.3 km2) | 2,694/sq mi (1,040/km2) |
| 4 | South Bend | 102,026 | 101,168 | +0.85% | St. Joseph | 41.46 sq mi (107.4 km2) | 2,466/sq mi (952/km2) |
| 5 | Carmel | 101,068 | 79,191 | +27.63% | Hamilton | 47.46 sq mi (122.9 km2) | 1,943/sq mi (750/km2) |
| 6 | Fishers | 95,310 | 76,794 | +24.11% | Hamilton | 33.59 sq mi (87.0 km2) | 2,734/sq mi (1,056/km2) |
| 7 | Bloomington | 85,755 | 80,405 | +6.65% | Monroe | 23.16 sq mi (60.0 km2) | 3,673/sq mi (1,418/km2) |
| 8 | Hammond | 75,522 | 80,830 | −6.57% | Lake | 22.78 sq mi (59.0 km2) | 3,363/sq mi (1,299/km2) |
| 9 | Gary | 74,879 | 80,294 | −6.74% | Lake | 49.87 sq mi (129.2 km2) | 1,524/sq mi (588/km2) |
| 10 | Lafayette | 71,721 | 67,140 | +6.82% | Tippecanoe | 27.74 sq mi (71.8 km2) | 2,610/sq mi (1,008/km2) |
| 11 | Muncie | 67,999 | 70,085 | −2.98% | Delaware | 27.60 sq mi (71.49 km2) | 2,518.06/sq mi (972.23/km2) |
| 12 | Noblesville | 64,668 | 51,969 | +24.44% | Hamilton | 33.56 sq mi (86.93 km2) | 1,871.36/sq mi (722.53/km2) |
| 13 | Terre Haute | 60,753 | 60,785 | −0.05% | Vigo | 35.27 sq mi (91.35 km2) | 1,761.32/sq mi (680.05/km2) |
| 14 | Kokomo | 58,020 | 45,468 | +27.61% | Howard | 36.76 sq mi (95.20 km2) | 1,580.33/sq mi (610.18/km2) |
| 15 | Greenwood | 59,458 | 49,791 | +19.42% | Johnson | 27.91 sq mi (72.28 km2) | 2,026.27/sq mi (782.34/km2) |
| 16 | Anderson | 54,765 | 56,129 | −2.43% | Madison | 42.77 sq mi (110.77 km2) | 1,292.28/sq mi (498.96/km2) |
| 17 | Elkhart | 52,358 | 50,949 | +2.77% | Elkhart | 27.26 sq mi (70.61 km2) | 1,986.34/sq mi (766.92/km2) |
| 18 | Mishawaka | 50,363 | 48,252 | +4.37% | St. Joseph | 17.93 sq mi (46.44 km2) | 2,765.22/sq mi (1,067.68/km2) |
| 19 | Lawrence | 49,462 | 46,001 | +7.52% | Marion | 20.25 sq mi (52.45 km2) | 2,376.19/sq mi (917.47/km2) |
| 20 | Jeffersonville | 48,126 | 44,953 | +7.06% | Clark | 34.38 sq mi (89.06 km2) | 1,381.98/sq mi (533.59/km2) |
| 21 | Columbus | 48,046 | 44,061 | +9.04% | Bartholomew | 28.41 sq mi (73.58 km2) | 1,682.06/sq mi (649.44/km2) |
| 22 | West Lafayette | 50,996 | 29,596 | +72.31% | Tippecanoe | 13.81 sq mi (35.77 km2) | 3,323.58/sq mi (1,283.22/km2) |
| 23 | Westfield | 43,649 | 30,068 | +45.17% | Hamilton | 29.92 sq mi (77.48 km2) | 1,253.27/sq mi (483.89/km2) |
| 24 | Portage | 36,988 | 36,828 | +0.43% | Porter | 27.61 sq mi (71.51 km2) | 1,430.67/sq mi (552.39/km2) |
| 25 | New Albany | 36,843 | 36,372 | +1.29% | Floyd | 15.11 sq mi (39.13 km2) | 2,454.81/sq mi (947.79/km2) |
| 26 | Richmond | 35,342 | 36,812 | −3.99% | Wayne | 24.16 sq mi (62.57 km2) | 1,486.19/sq mi (573.82/km2) |
| 27 | Valparaiso | 33,897 | 31,730 | +6.83% | Porter | 16.31 sq mi (42.25 km2) | 2,035.42/sq mi (785.88/km2) |
| 28 | Goshen | 34,217 | 31,719 | +7.88% | Elkhart | 17.03 sq mi (44.10 km2) | 1,983.31/sq mi (765.76/km2) |
| 29 | Michigan City | 31,015 | 31,479 | −1.47% | LaPorte | 22.93 sq mi (59.38 km2) | 1,584.55/sq mi (611.81/km2) |
| 30 | Crown Point | 30,488 | 27,317 | +11.61% | Lake | 17.84 sq mi (46.20 km2) | 1,660.59/sq mi (641.17/km2) |
| 31 | Marion | 27,930 | 29,948 | −6.74% | Grant | 15.58 sq mi (40.35 km2) | 1,835.41/sq mi (708.67/km2) |
| 32 | Hobart | 27,939 | 29,059 | −3.85% | Lake | 26.22 sq mi (67.92 km2) | 1,077.22/sq mi (415.92/km2) |
| 33 | East Chicago | 27,817 | 29,698 | −6.33% | Lake | 14.09 sq mi (36.49 km2) | 2,016.89/sq mi (778.75/km2) |
| 34 | Franklin | 25,608 | 23,712 | +8.00% | Johnson | ||
| 35 | Greenfield | 23,006 | 20,602 | +11.67% | Hancock | ||
| 36 | La Porte | 21,569 | 22,053 | −2.19% | LaPorte | ||
| 37 | Seymour | 19,959 | 17,503 | +14.03% | Jackson | ||
| 38 | Shelbyville | 19,407 | 19,191 | +1.13% | Shelby | ||
| 39 | Logansport | 17,584 | 18,396 | −4.41% | Cass | ||
| 40 | Vincennes | 16,862 | 18,423 | −8.47% | Knox | ||
| 41 | New Castle | 17,113 | 18,114 | −5.53% | Henry | ||
| 42 | Huntington | 17,138 | 17,391 | −1.45% | Huntington | ||
| 43 | Crawfordsville | 16,118 | 15,915 | +1.28% | Montgomery | ||
| 44 | Lebanon | 16,065 | 15,792 | +1.73% | Boone | ||
| 45 | Frankfort | 15,884 | 16,422 | −3.28% | Clinton | ||
| 46 | New Haven | 15,922 | 14,794 | +7.62% | Allen | ||
| 47 | Jasper | 15,724 | 15,038 | +4.56% | Dubois | ||
| 48 | Beech Grove | 14,937 | 14,192 | +5.25% | Marion | ||
| 49 | Warsaw | 15,150 | 13,559 | +11.73% | Kosciusko | ||
| 50 | Bedford | 13,212 | 13,413 | −1.50% | Lawrence | ||
| 51 | Auburn | 13,484 | 12,731 | +5.91% | DeKalb | ||
| 52 | Connersville | 12,796 | 13,481 | −5.08% | Fayette | ||
| 53 | Washington | 12,528 | 11,509 | +8.85% | Daviess | ||
| 54 | Lake Station | 11,845 | 12,572 | −5.78% | Lake | ||
| 55 | Greensburg | 11,891 | 11,492 | +3.47% | Decatur | ||
| 56 | Madison | 11,861 | 11,967 | −0.89% | Jefferson | ||
| 57 | Martinsville | 11,669 | 11,828 | −1.34% | Morgan | ||
| 58 | Peru | 11,023 | 11,417 | −3.45% | Miami | ||
| 59 | Greencastle | 10,270 | 10,326 | −0.54% | Putnam | ||
| 60 | Wabash | 9,941 | 10,666 | −6.80% | Wabash | ||
| 61 | Bluffton | 10,147 | 9,897 | +2.53% | Wells | ||
| 62 | Plymouth | 9,982 | 10,033 | −0.51% | Marshall | ||
| 63 | Kendallville | 9,894 | 9,862 | +0.32% | Noble | ||
| 64 | Decatur | 9,858 | 9,405 | +4.82% | Adams | ||
| 65 | Columbia City | 9,234 | 8,750 | +5.53% | Whitley | ||
| 66 | Angola | 8,732 | 8,612 | +1.39% | Steuben | ||
| 67 | Princeton | 8,733 | 8,644 | +1.03% | Gibson | ||
| 68 | Elwood | 8,394 | 8,614 | −2.55% | Madison, Tipton | ||
| 69 | Charlestown | 8,370 | 7,585 | +10.35% | Clark | ||
| 70 | Brazil | 7,993 | 7,912 | +1.02% | Clay | ||
| 71 | Tell City | 7,211 | 7,272 | −0.84% | Perry | ||
| 72 | Nappanee | 6,843 | 6,648 | +2.93% | Elkhart, Kosciusko | ||
| 73 | Scottsburg | 6,732 | 6,747 | −0.22% | Scott | ||
| 74 | North Vernon | 6,702 | 6,728 | −0.39% | Jennings | ||
| 75 | Batesville | 6,686 | 6,520 | +2.55% | Ripley, Franklin | ||
| 76 | Mount Vernon | 6,502 | 6,687 | −2.77% | Posey | ||
| 77 | Garrett | 6,413 | 6,286 | +2.02% | DeKalb | ||
| 78 | Boonville | 6,227 | 6,246 | −0.30% | Warrick | ||
| 79 | Salem | 6,201 | 6,319 | −1.87% | Washington | ||
| 80 | Portland | 6,002 | 6,223 | −3.55% | Jay | ||
| 81 | Huntingburg | 6,170 | 6,057 | +1.87% | Dubois | ||
| 82 | Rushville | 6,008 | 6,341 | −5.25% | Rush | ||
| 83 | Rochester | 5,994 | 6,218 | −3.60% | Fulton | ||
| 84 | Rensselaer | 5,842 | 5,859 | −0.29% | Jasper | ||
| 85 | Gas City | 5,772 | 5,965 | −3.24% | Grant | ||
| 86 | Hartford City | 5,660 | 6,220 | −9.00% | Blackford | ||
| 87 | Monticello | 5,243 | 5,378 | −2.51% | White | ||
| 88 | Linton | 5,204 | 5,413 | −3.86% | Greene | ||
| 89 | Tipton | 4,970 | 5,106 | −2.66% | Tipton | ||
| 90 | Lawrenceburg | 5,001 | 5,042 | −0.81% | Dearborn | ||
| 91 | Alexandria | 4,968 | 5,145 | −3.44% | Madison | ||
| 92 | Whiting | 4,765 | 4,997 | −4.64% | Lake | ||
| 93 | Clinton | 4,686 | 4,893 | −4.23% | Vermillion | ||
| 94 | Winchester | 4,665 | 4,935 | −5.47% | Randolph | ||
| 95 | Greendale | 4,341 | 4,520 | −3.96% | Dearborn | ||
| 96 | Ligonier | 4,379 | 4,405 | −0.59% | Noble | ||
| 97 | Mitchell | 4,249 | 4,350 | −2.32% | Lawrence | ||
| 98 | Berne | 4,247 | 3,999 | +6.20% | Adams | ||
| 99 | Austin | 4,118 | 4,295 | −4.12% | Scott | ||
| 100 | Sullivan | 4,093 | 4,249 | −3.67% | Sullivan | ||
| 101 | Aurora | 3,676 | 3,750 | −1.97% | Dearborn | ||
| 102 | Knox | 3,545 | 3,704 | −4.29% | Starke | ||
| 103 | Union City | 3,440 | 3,584 | −4.02% | Randolph | ||
| 104 | Attica | 3,241 | 3,245 | −0.12% | Fountain | ||
| 105 | Delphi | 2,909 | 2,893 | +0.55% | Carroll | ||
| 106 | Bicknell | 2,840 | 2,915 | −2.57% | Knox | ||
| 107 | Loogootee | 2,700 | 2,751 | −1.85% | Martin | ||
| 108 | Butler | 2,718 | 2,684 | +1.27% | DeKalb | ||
| 109 | Covington | 2,500 | 2,645 | −5.48% | Fountain | ||
| 110 | Oakland City | 2,404 | 2,429 | −1.03% | Gibson | ||
| 111 | Dunkirk | 2,255 | 2,362 | −4.53% | Blackford, Jay | ||
| 112 | Petersburg | 2,317 | 2,383 | −2.77% | Pike | ||
| 113 | Rockport | 2,144 | 2,270 | −5.55% | Spencer | ||
| 114 | Rising Sun | 2,139 | 2,304 | −7.16% | Ohio | ||
| 115 | Jasonville | 2,122 | 2,222 | −4.50% | Greene | ||
| 116 | Southport | 1,770 | 1,712 | +3.39% | Marion | ||
| 117 | Montpelier | 1,654 | 1,805 | −8.37% | Blackford | ||
| 118 | Jonesboro | 1,643 | 1,756 | −6.44% | Grant | ||
| 119 | Woodburn | 1,639 | 1,520 | +7.83% | Allen | ||
| 120 | Cannelton | 1,481 | 1,563 | −5.25% | Perry |
See also
- List of towns in Indiana
- List of metropolitan areas in Indiana
- List of Micropolitan Statistical Areas of Indiana
- List of census-designated places in Indiana
References
- ^ "City and Town Population Tables: 2010-2017". United States Census Bureau. Retrieved 1 June 2018.
- ^ "2010 Census Redistricting Data (Public Law 94-171) Summary File". American FactFinder2. U.S. Census Bureau, 2010 Census. Retrieved 16 February 2014.
External links