Garcia Hernandez | |
|---|---|
| Municipality of Garcia Hernandez | |
) Garcia Hernandez – public market | |
) Flag ) Seal | |
) Map of Bohol with Garcia Hernandez highlighted | |
OpenStreetMap 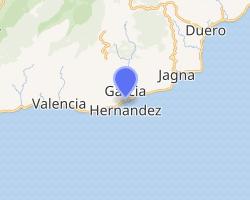 | |
.svg.gif')) Garcia Hernandez Location within the Philippines | |
| Coordinates: 9°36′52″N 124°17′41″E / 9.6144°N 124.2946°E | |
| Country | |
| Region | Central Visayas (Region VII) |
| Province | Bohol |
| District | 3rd District |
| Barangays | 30 (see Barangays) |
| Government | |
| • Type | Sangguniang Bayan |
| • Mayor | Tita B. Gallentes |
| • Vice Mayor | Miguelito B. Galendez |
| • Representative | Kristine Alexie B. Tutor |
| • Electorate | 16,374 voters (2019) |
| Area | |
| • Total | 127.50 km2 (49.23 sq mi) |
| Elevation | 128 m (420 ft) |
| Population (2015 census) [3] | |
| • Total | 24,194 |
| • Density | 190/km2 (490/sq mi) |
| • Households | 4,967 |
| Economy | |
| • Income class | 4th municipal income class |
| • Poverty incidence | 26.34% (2015)[4] |
| • Revenue | ₱83,548,424.76 (2016) |
| Time zone | UTC+8 (PST) |
| ZIP code | 6307 |
| PSGC | |
| IDD : area code | +63 (0)38 |
| Climate type | tropical monsoon climate |
| Native languages | Boholano dialect Cebuano Tagalog |
| Website | garciahernandez |
Garcia Hernandez, officially the Municipality of Garcia Hernandez (Cebuano: Lungsod sa Garcia Hernandez; Tagalog: Bayan ng Garcia Hernandez), is a 4th class municipality in the province of Bohol, Philippines. According to the 2015 census, it has a population of 24,194 people. [3]
The town is home to the sacred burial cave of Kalagan.[5]
Barangays
Garcia Hernandez comprises 30 barangays:
| PSGC | Barangay | Population | ±% p.a. | Area | PD 2015 | |||||
|---|---|---|---|---|---|---|---|---|---|---|
| 2015 [3] | 2010 [6] | ha | acre | /km2 | /sq mi | |||||
| 071222001 | Abijilan | 5.8% | 1,411 | 1,479 | −0.89% | 820 | 2,026 | 170 | 450 | |
| 071222002 | Antipolo | 2.5% | 613 | 627 | −0.43% | 522 | 1,290 | 120 | 300 | |
| 071222003 | Basiao | 2.2% | 532 | 514 | 0.66% | 236 | 583 | 230 | 580 | |
| 071222004 | Cagwang | 1.5% | 351 | 340 | 0.61% | 532 | 1,315 | 66 | 170 | |
| 071222005 | Calma | 3.1% | 759 | 752 | 0.18% | 126 | 311 | 600 | 1,600 | |
| 071222006 | Cambuyo | 2.6% | 638 | 614 | 0.73% | 642 | 1,586 | 99 | 260 | |
| 071222007 | Canayaon East | 3.8% | 925 | 931 | −0.12% | 211 | 521 | 440 | 1,100 | |
| 071222008 | Canayaon West | 4.0% | 965 | 945 | 0.40% | 194 | 479 | 500 | 1,300 | |
| 071222009 | Candanas | 3.2% | 765 | 771 | −0.15% | 735 | 1,816 | 100 | 270 | |
| 071222010 | Candulao | 1.9% | 459 | 422 | 1.61% | 132 | 326 | 350 | 900 | |
| 071222011 | Catmon | 1.1% | 277 | 220 | 4.48% | 240 | 593 | 120 | 300 | |
| 071222012 | Cayam | 4.7% | 1,140 | 1,194 | −0.88% | 541 | 1,337 | 210 | 550 | |
| 071222013 | Cupa | 0.9% | 218 | 212 | 0.53% | 245 | 605 | 89 | 230 | |
| 071222014 | Datag | 5.2% | 1,268 | 1,184 | 1.31% | 1,289 | 3,185 | 98 | 250 | |
| 071222015 | Estaca | 0.8% | 203 | 194 | 0.87% | 194 | 479 | 100 | 270 | |
| 071222016 | Libertad | 1.8% | 436 | 421 | 0.67% | 380 | 939 | 110 | 300 | |
| 071222017 | Lungsodaan East | 4.6% | 1,114 | 1,098 | 0.28% | 718 | 1,774 | 160 | 400 | |
| 071222018 | Lungsodaan West | 4.6% | 1,105 | 997 | 1.98% | 637 | 1,574 | 170 | 450 | |
| 071222019 | Malinao | 5.5% | 1,338 | 1,046 | 4.80% | 634 | 1,567 | 210 | 550 | |
| 071222020 | Manaba | 7.1% | 1,723 | 1,679 | 0.49% | 296 | 731 | 580 | 1,500 | |
| 071222021 | Pasong | 4.6% | 1,101 | 918 | 3.52% | 684 | 1,690 | 160 | 420 | |
| 071222022 | Poblacion East | 5.7% | 1,370 | 1,328 | 0.59% | 439 | 1,085 | 310 | 810 | |
| 071222023 | Poblacion West | 3.7% | 906 | 961 | −1.12% | 422 | 1,043 | 210 | 560 | |
| 071222024 | Sacaon | 2.6% | 629 | 614 | 0.46% | 253 | 625 | 250 | 640 | |
| 071222025 | Sampong | 1.0% | 243 | 241 | 0.16% | 524 | 1,295 | 46 | 120 | |
| 071222026 | Tabuan | 5.4% | 1,318 | 1,277 | 0.60% | 750 | 1,853 | 180 | 460 | |
| 071222027 | Togbongon | 1.3% | 324 | 367 | −2.34% | 388 | 959 | 84 | 220 | |
| 071222028 | Ulbujan East | 2.9% | 690 | 673 | 0.48% | 419 | 1,035 | 160 | 430 | |
| 071222029 | Ulbujan West | 3.4% | 831 | 745 | 2.10% | 426 | 1,053 | 200 | 510 | |
| 071222030 | Victoria | 1.1% | 272 | 274 | −0.14% | 118 | 292 | 230 | 600 | |
| Total | 24,194 | 23,038 | 0.94% | 12,750 | 31,506 | 190 | 490 | |||
Climate
| Climate data for Garcia Hernandez, Bohol | |||||||||||||
|---|---|---|---|---|---|---|---|---|---|---|---|---|---|
| Month | Jan | Feb | Mar | Apr | May | Jun | Jul | Aug | Sep | Oct | Nov | Dec | Year |
| Average high °C (°F) | 28 (82) | 29 (84) | 30 (86) | 31 (88) | 31 (88) | 30 (86) | 30 (86) | 30 (86) | 30 (86) | 29 (84) | 29 (84) | 29 (84) | 30 (85) |
| Average low °C (°F) | 23 (73) | 22 (72) | 23 (73) | 23 (73) | 24 (75) | 25 (77) | 24 (75) | 24 (75) | 24 (75) | 24 (75) | 23 (73) | 23 (73) | 24 (74) |
| Average precipitation mm (inches) | 102 (4.0) | 85 (3.3) | 91 (3.6) | 75 (3.0) | 110 (4.3) | 141 (5.6) | 121 (4.8) | 107 (4.2) | 111 (4.4) | 144 (5.7) | 169 (6.7) | 139 (5.5) | 1,395 (55.1) |
| Average rainy days | 18.6 | 14.8 | 16.5 | 16.7 | 23.9 | 26.4 | 25.6 | 24.1 | 24.4 | 26.3 | 23.7 | 20.5 | 261.5 |
| Source: Meteoblue [7] | |||||||||||||
Demographics
| Year | Pop. | ±% p.a. |
|---|---|---|
| 1903 | 6,060 | — |
| 1918 | 8,555 | +2.33% |
| 1939 | 11,486 | +1.41% |
| 1948 | 13,690 | +1.97% |
| 1960 | 12,828 | −0.54% |
| 1970 | 13,604 | +0.59% |
| 1975 | 16,701 | +4.20% |
| 1980 | 16,715 | +0.02% |
| 1990 | 18,956 | +1.27% |
| 1995 | 21,323 | +2.23% |
| 2000 | 21,428 | +0.11% |
| 2007 | 21,308 | −0.08% |
| 2010 | 23,038 | +2.88% |
| 2015 | 24,194 | +0.94% |
| Source: Philippine Statistics Authority [3] [6] [8][9] | ||
Parishes
- Saint John the Baptist
- Saint Isidore the Farmer
Gallery
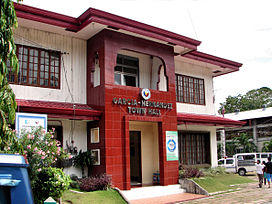
Municipal hall
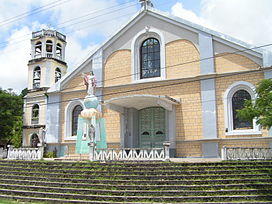
Roman Catholic Church
)
)
References
- ^ Municipality of Garcia Hernandez | (DILG)
- ^ "Province: Bohol". PSGC Interactive. Quezon City, Philippines: Philippine Statistics Authority. Retrieved 12 November 2016.
- ^ a b c d Census of Population (2015). "Region VII (Central Visayas)". Total Population by Province, City, Municipality and Barangay. PSA. Retrieved 20 June 2016.
- ^ "PSA releases the 2015 Municipal and City Level Poverty Estimates". Quezon City, Philippines. Retrieved 12 October 2019.
- ^ https://www.youtube.com/watch?v=9HKVqCjopT8
- ^ a b Census of Population and Housing (2010). "Region VII (Central Visayas)". Total Population by Province, City, Municipality and Barangay. NSO. Retrieved 29 June 2016.
- ^ "Garcia Hernandez: Average Temperatures and Rainfall". Meteoblue. Retrieved 9 May 2020.
- ^ Censuses of Population (1903–2007). "Region VII (Central Visayas)". Table 1. Population Enumerated in Various Censuses by Province/Highly Urbanized City: 1903 to 2007. NSO.
- ^ "Province of Bohol". Municipality Population Data. Local Water Utilities Administration Research Division. Retrieved 17 December 2016.