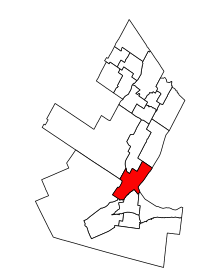
Burlington Ontario electoral district Ontario electoral district |
|---|
 Burlington in relation to other Ontario electoral districts (2015 boundaries) |
| Federal electoral district |
|---|
| Legislature | House of Commons |
|---|
| MP | Karina Gould
Liberal |
|---|
| District created | 1976 |
|---|
| First contested | 1979 |
|---|
| Last contested | 2019 |
|---|
| District webpage | profile, map |
|---|
| Demographics |
|---|
| Population (2011)[1] | 120,569 |
|---|
| Electors (2015) | 94,679 |
|---|
| Area (km²)[2] | 84 |
|---|
| Pop. density (per km²) | 1,435.3 |
|---|
| Census division(s) | Halton |
|---|
| Census subdivision(s) | Burlington |
|---|
.gif)
Map of Burlington riding (2003 boundaries)
Burlington is a federal electoral district in Halton Region, Ontario, Canada, that has been represented in the House of Commons of Canada since 1979.
Geography
It consists of the southern part of the city of Burlington, Ontario.
The riding serves downtown Burlington and the neighbourhoods of Aldershot, Maple, Freeman, Wellington Square, Dynes, Roseland, Longmoor, Shoreacres, Pinedale, Elizabeth Gardens, Palmer, Mountainside, Brant Hills, and Tyandaga in Burlington.
History
Burlington was created in 1976 from Halton—Wentworth.
This riding gained small territories from Halton and Ancaster—Dundas—Flamborough—Westdale during the 2012 electoral redistribution.
Members of Parliament
This riding has elected the following Members of Parliament:
Election results
Graph of election results in Burlington (minor parties that never got 2% of the vote or didn't run consistently are omitted)
| 2019 Canadian federal election |
| Party | Candidate | Votes | % | | Expenditures |
| | Liberal | Karina Gould | 34,989 | 48.61 | +2.63 | $106,261.57 |
| | Conservative | Jane Michael | 23,930 | 33.24 | -9.24 | $86,302.63 |
| | New Democratic | Lenaee Dupuis | 7,372 | 10.24 | +1.14 | $31,070.76 |
| | Green | Gareth Williams | 4,750 | 6.60 | +4.16 | $6,940.18 |
| | People's | Peter Smetana | 944 | 1.31 | +1.31 | $5,500.00 |
| Total valid votes/Expense limit | 71,985 | 100.0 |
| Total rejected ballots | 600 |
| Turnout | 72,585 | 72.6 |
| Eligible voters | 99,972 |
| Source: Elections Canada[3][4] |
| 2015 Canadian federal election |
| Party | Candidate | Votes | % | | Expenditures |
| | Liberal | Karina Gould | 32,229 | 45.98 | +22.74 | $104,313.08 |
| | Conservative | Mike Wallace | 29,780 | 42.48 | -11.66 | $105,053.18 |
| | New Democratic | David Laird | 6,381 | 9.10 | -9.75 | $28,503.64 |
| | Green | Vince Fiorito | 1,710 | 2.44 | -1.10 | $1,631.97 |
| Total valid votes/Expense limit | 70,100 | 100.00 | | $239,840.79 |
| Total rejected ballots | 263 | 0.37 |
| Turnout | 70,363 | 73.58 |
| Eligible voters | 95,624 |
| | Liberal gain from Conservative | Swing | +17.20 |
| Source: Elections Canada[5][6] |
| 2011 federal election redistributed results[7] |
| Party | Vote | % |
| | Conservative | 33,162 | 54.14 |
| | Liberal | 14,235 | 23.24 |
| | New Democratic | 11,549 | 18.85 |
| | Green | 2,166 | 3.54 |
| | Others | 140 | 0.23 |
| 2011 Canadian federal election |
| Party | Candidate | Votes | % | | Expenditures |
| | Conservative | Mike Wallace | 32,958 | 54.16 | +5.56 | $87,782.46 |
| | Liberal | Alyssa Brierley | 14,154 | 23.26 | -9.99 | $83,688.54 |
| | New Democratic | David Carter Laird | 11,449 | 18.81 | +7.61 | $17,387.19 |
| | Green | Graham Mayberry | 2,151 | 3.53 | -3.40 | $4,138.76 |
| | Marxist–Leninist | Elaine Baetz | 140 | 0.23 | – | |
| Total valid votes/Expense limit | 60,852 | 100.00 | – | $94,992.81 |
| Total rejected ballots | 175 | 0.29 | -0.12 |
| Turnout | 61,027 | 67.02 | +2.03 |
| Eligible voters | 91,058 | – | – |
| 2008 Canadian federal election |
| Party | Candidate | Votes | % | | Expenditures |
| | Conservative | Mike Wallace | 28,614 | 48.60 | +5.50 | $82,440 |
| | Liberal | Paddy Torsney | 19,577 | 33.25 | -5.86 | $86,026 |
| | New Democratic | David Carter Laird | 6,597 | 11.20 | -1.24 | $21,862 |
| | Green | Marnie Mellish | 4,083 | 6.93 | +1.60 | $2,280 |
| Total valid votes/Expense limit | 58,871 | 100.00 | – | $92,099 |
| Total rejected ballots | 239 | 0.40 | +0.05 |
| Turnout | 59,110 | 64.99 |
Note: Conservative vote is compared to the total of the Canadian Alliance vote and Progressive Conservative vote in 2000 election.
Note: Canadian Alliance vote is compared to the Reform vote in 1997 election.
See also
References
Notes

.gif)